

The Benefits of Production Data
SAEBY is one of the many food manufacturing companies to tackle the challenges within the industry. There are more requirements and expectations than ever before, many led by trends. They began using TARGIT Decision Suite to better understand the data across their organization. SAEBY will leverage the data to make impactful, data-driven decisions.
Pia Falden is Head of Finance at SAEBY and has over 20 years of experience in auditing, accounting, and advisory business in a variety of industries. Falden states that SAEBY has benefited from implementing their solution, so it was important to Falden and her team to share their experiences with other organizations that are developing production data or that are considering leveraging business intelligence (BI) and analytics within other business areas.
Falden described how TARGIT has been a crucial part of SAEBY’s data journey. “Due to our large sales volume, small margins, and total dependency on Bill of Material (BOM) accuracy, there is no room for inaccuracies with our production data,” Falden said.
In the spring of 2020, SAEBY implemented TARGIT's solution as we wanted to be more data-driven in our daily decision-making. Therefore, we had to make our data more accessible. After implementing TARGIT on the more basic and standard areas, such as sales and purchases, we also decided to implement it on our production data.
It’s important to discuss why it’s necessary for our organization to have insight into our production data. Being a producer in the food industry is a tough business. We’re consistently pressured by heavy price competition. Our daily business is characterized by large production and sales volumes, but small margins. Because of the small margins, we must know our production price.
The bottom line is that it’s essential for us that the theoretical BOMs that we configure in our ERP systems are as close to reality as possible. The ongoing question: How can we estimate a sensible markup on our products and still be price competitive in the market?
SAEBY’s Journey to Production Data: Our Journey So Far
Step One: Create a BI Team
Falden and her team first decided on the integral members of the management of this project. “I took the lead of the team as I was the main point of contact with TARGIT and had direct insights into our ERP data. We made sure to represent the production side since they knew our production system data (Marel/Innova) and knowledge from the production floor,” Falden said.
Step Two: Map the Process
Once the team was set, they began to map the production process. At SAEBY, there are two primary processes: purchasing fresh fish and producing canned mackerel.
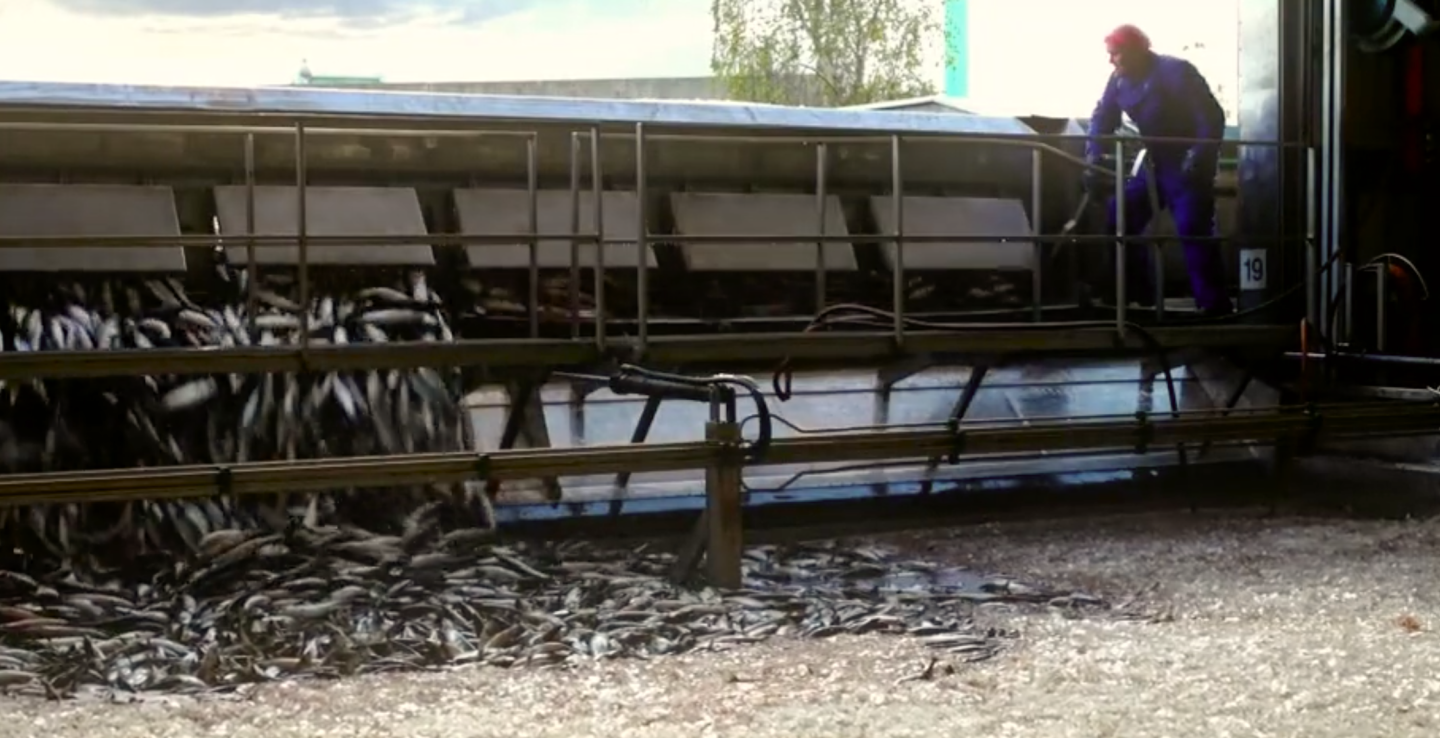
Our purchasing period lasts effectively about one month a year. We transport the fish from the fishing vessels in Hirtshal or Skagen to our location in Sæby by truck. Once here, the fish is cleaned, and within 45 minutes, every fish is single-frozen to -30 degrees and put in cold storage. Once stored, the fish is our raw material inventory for the entire year of canned mackerel production. The purchasing process is vital for our company because our annual revenue depends on it.
The other primary process is producing canned mackerel. The daily production starts with deskinning the frozen mackerel by using boiled water which is one of the main differences with our competitors who use chemicals to deskin the fish. Once the fish is ready, it gets steam-cooked, hand-fileted to put into the can, poured over with sauce or oil, and then closed and autoclaved to prevent bacterial development. Once this process is done, the production is packed as the customers' wish and distributed.
Step Three: Map the Existing Data Catches
Once the mapping of the production process was done, SAEBY verified that each member of the team understood the processes of the daily work.
Then, we began to map our existing data catches and registration points. So how did we do that in practice? The Post-it Note exercise.

We took an existing technical drawing of our plant and production lines, and we literally put them up on the wall in the office. Then, we started to put a post-it on the drawing anywhere there was a data catch or data registration. The color of the post-it depended on which system the data was from. We were also very observant about whether the data was theoretical or a ”reality” measurement data catch.
We would ask ourselves if a specific data pot was a calculated figure based on production assumptions OR if there was an actual weight built-in at the beginning of each production line, and we measure the weight of everything that runs down the chain. With questions like that, we were able to get answers with knowledge from Finance to the ERP and production side from the floor.
This Post-it Note exercise gave us, as a team, the awareness of how our data were measured and filed in different programs. It gave visibility to the need to be able to compare the data from the various systems. We found that we needed to have data from Marel/Innova, Navision, and other systems in one place to be able to compare them to each other in an easy way. That’s when TARGIT came to light.
Step Four: Connect the Dots
We were hoping that TARGIT could help us connect these data to get a quick overview of our production economy. After identifying which data we had in our possession, we also became aware of which exact data and measure points we wanted to extract easily and quickly by using TARGIT.
Step Five: Develop KPIs Wishes
The next step in SAEBY’s journey was to develop key performance indicator (KPI) wishes. “I made a drawing illustrating which data from our ERP system TARGIT had located and extracted from us, and which data from our Marel/Innova production system TARGIT had to get. The blue bubble in the middle illustrates the KPIs where our ERP system meets our production system.”

We defined and prioritized five KPIs. Then, TARGIT used this to estimate the project's price. This is when TARGIT was brought in as part of the team. Our five initial KPIs were:
- Deskinning Percentage
- Yield Percentage
- Index comparing the consumption of fish per day versus theoretically calculated consumption on the days' production
- Index comparing fish weight in the can according to BOM’s (theoretical) versus actual measured fish weight per can
- Index comparing actual consumption of fish per production order versus the actual produced number of cans
Step Six: Validation and Testing of KPIs
A crucial step is to validate and test if the dashboards and reports that were created display the KPIs accurately and in a comprehensible format.
After going through this experience, I advise you never to underestimate this step because it’s essential that the KPIs that you give to the organization are validated so that everyone in your organization trusts the numbers you are proving via all of the dashboards and reports you created for them.
”This journey took us about three months, and I believe we were efficient because, from the start of the project, the parties involved knew their roles and responsibilities. I’m proud of my team for taking the time to do the due diligence to map our production process. That helped define our KPIs clearly. I’m also happy to have picked the right data partner."
TARGIT's extensive knowledge in the Navision and BI and Analytics worlds helped us visualize our KPIs wishes in an easy way for everyone in the company to digest. Most importantly, SAEBY can now make data-driven decisions.

Where Did Production Data Take SAEBY?
Falden said production data has given SAEBY better knowledge about their production economy.
“We much quicker identify errors in our BOMs (bill of material), which is fantastic. We have an easier and more accessible way to follow up on our production orders. Finally, it's easier for us to check whether the theoretical production assumptions built in our BOM are correct, allowing us to be price competitive in the market.”
