Business intelligence (BI) software can support multiple facets of your organization, including how you manage supply chain analytics and measure critical performance data.
Here are four ways your BI platform can help support more efficient supply chain operations:
#1 Increased Visibility
Your organization’s supply chain is complex — multiple departments manage unique workflows, and you may even outsource key processes to third-party vendors or external suppliers.

With so many moving pieces, employees often find themselves putting in extra hours to align disparate data sources or locate critical information. When information is overlooked or entered incorrectly into the system, cross-functional departments are at a disadvantage. Without clarity into their counterparts’ operations or existing bottlenecks, these teams can’t reach their full potential.
The good news is that these data-driven processes don’t have to be manual. Instead, you can implement an end-to-end business intelligence platform that unifies and organizes data from every touchpoint into a single supply chain analytics view. From there, you can give relevant teams and stakeholders access to custom dashboards that translate in-depth data into actionable insights.
This added visibility helps you keep things running smoothly day-to-day. A centralized approach also enables your teams to align priorities and processes across the board.
#2 Root Cause Analysis
Supply chain managers address numerous time-sensitive issues and critical alerts each day. Their response to each depends heavily on the context they have, not only on what occurred but also on how and why it happened. As you balance a never-ending list of to-dos, you need BI and supply chain analytics software that goes beyond simply flagging an error or concerning activity.

For example, suppose you notice recurring shipment rejection notices from your carrier. However, you can’t see why each shipment was rejected. In that case, you may spend hours manually chasing down the details, or worse, reaching out to the wrong department to follow up on the notice.
Instead of taking your best guess at error resolution, you need insight into how, where, and why the problem occurred in the first place. This allows you to see the complete picture — and the more information you can gather around what caused a particular roadblock or error, the more effectively you can prevent future occurrences.
Exploring the root causes of various problems also exposes the costs associated with your current operations. As you use data to identify where you’re sinking extra expenses, you can refine your processes and cut out unnecessary inefficiencies to reduce costs across multiple points in your supply chain.
#3 Advanced Reporting
Your BI and supply chain analytics tool should provide real-time alerts and present robust data insights in digestible dashboards. However, the value of your platform shouldn’t stop on the ground floor.
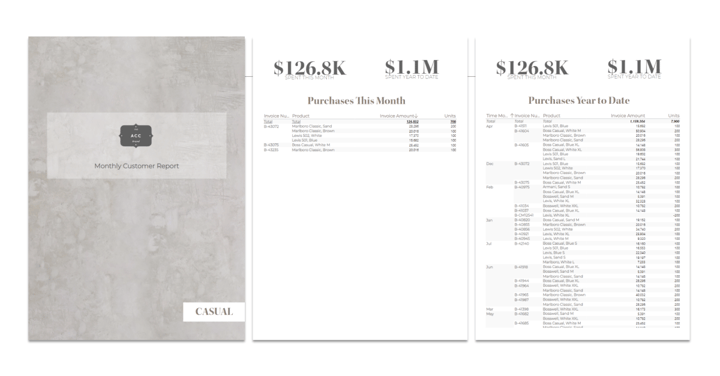
Instead, the insights you collect and record should produce reports that you can share with key players in your organization. These reports should be customizable and configurable based on their audience so that you can share:
- Forecasting and high-level KPIs with stakeholders
- Team and individual performance with department heads
- Detailed readouts and process breakdowns with individual team members
These reports help keep teams on track. They can also inform your overarching business development strategy. With deeper insight into individual team performance, overall supply chain efficiency, and common challenges that arise along the way, you and your stakeholders can make informed decisions about process improvements, key growth opportunities, and more.
Plus, sharing high-value data insights with your stakeholders and leadership teams helps bolster your reputation and present workflows backed by historical data, not just hunches or vague recommendations.
#4 User-Friendly Tools
Regardless of your organization's age or size, your employees likely have established processes and workflows. These may include predefined workflows established by leadership or ad hoc approaches to meet various internal and external needs. Either way, once your teams grow accustomed to a certain way of working, it’s challenging to get them on board with new processes or tools.

While low user adoption rates can be frustrating, they often stem from your choice of tool or platform. If you adopt a new toolset that’s tough to use or requires hours of training and a deep level of technical knowledge to operate, your employees will likely resist the change.
The right BI and supply chain analytics platform should include intuitive tools that anyone in your organization can access and use. So steer clear of clunky platforms that require extensive technical knowledge or hours of setup to integrate with your existing tools and processes.
Instead, look for vendors that offer a user-friendly platform, embedded analytics, seamless data integration features, and configurable reporting dashboards that promote user adoption across teams and departments.
The right BI and supply chain analytics solution can drive measurable results across your supply chain. In addition, it can empower your teams to make informed decisions and process improvements.
Our BI and Analytics software, TARGIT Decision Suite, is designed to turn intelligence into real business impact. We help our customers curate actionable insights that lead to better and faster decisions to improve profitability, productivity, and competitiveness.
Request a personalized demo today to see an in-depth walkthrough of our platform and learn how we help organizations realize the full value of their data.